DooM WAD Level Selector
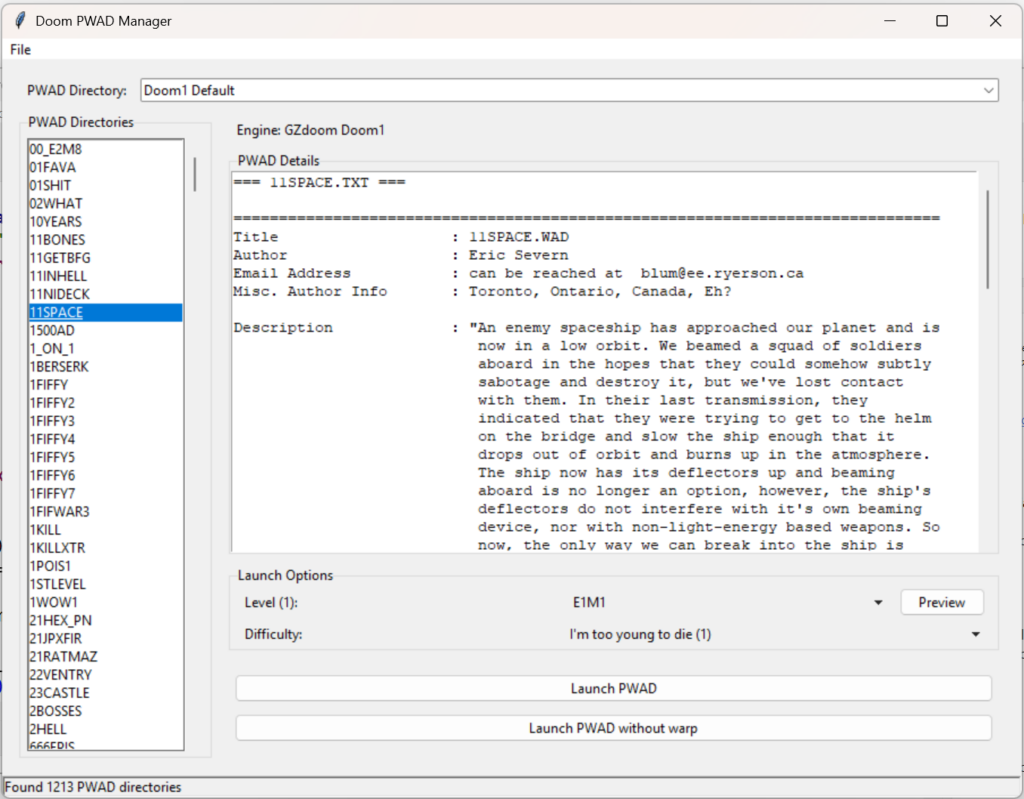
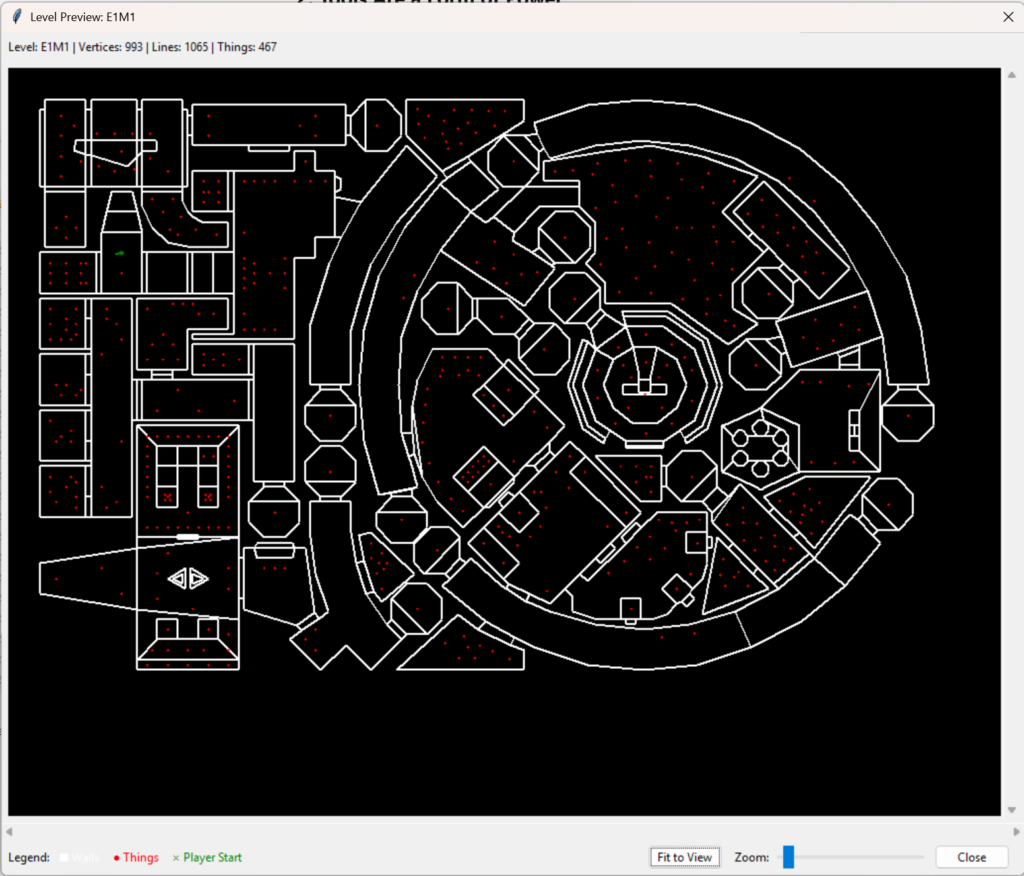
I was going through old CDs and came across some doom wads, levels for the old DooM. So I fired up GZdoom and tried a few but it got kind of tiring going through command line so I had AI (mostly) write a WAD file loader. The result is the aptly named Doom PWAD Manager. It can load pwads and display a preview and give you info.


You can define multiple engines and multiple directories. You can have directory specific command line terms or based on the engine. The WAD files MUST be unzipped into subdirectories in whatever directories you choose, it will not read from a zip.
Below is the download, I took the liberty of making it an EXE if you like, source is there too though.
https://www.smackaay.com/wp-content/uploads/2025/03/PWADManager.zip
enjoy.
08.25.24Demographic charts
So, I’m pretty interested in the state of the world and how populations in wealthier countries are starting to fall. I was kind of looking at charts, population pyramid charts to be exact and I found that population pyramids, while interesting don’t show the decline in as interesting way as a line graph. So I took it upon myself to grab the info and change them into line graphs that can be viewed more easily. Below are a bunch for your perusal.
Working age population – WorldWorking age population – Canada
Working age population – Japan
Working age population – Least Developed Countries
Working age population – More Developed Countries
Working age population – Russian Federation
Working age population – United Kingdom
Working age population – United States
Population – World
Population – Canada
Population – Japan
Population – Least Developed Countries
Population – More Developed Countries
Population – Russian Federation
Population – United Kingdom
Population – United States
Population Percentage – World
Population Percentage – Canada
Population Percentage – Japan
Population Percentage – Least Developed Countries
Population Percentage – More Developed Countries
Population Percentage – Russian Federation
Population Percentage – United Kingdom
Population Percentage – United States
Working Population Percentage – World
Working Population Percentage – Canada
Working Population Percentage – Japan
Working Population Percentage – Least Developed Countries
Working Population Percentage – More Developed Countries
Working Population Percentage – Russian Federation
Working Population Percentage – United Kingdom
Working Population Percentage – United States
There we go, it’s pretty straightforward. You can click the labels on the side to turn on/off certain lines to highlight what you want to see. Clicking on a link will open new window, also, if you change the windows size, please refresh to make it fit your window. To explain we have a number of data sets here, population of a given region, percentage of population of a given region, population of people of working age of a given region and finally a percentage of the working population of a given region. I chose regions/countries that made sense to me. I could’ve picked China but I don’t trust their numbers on anything, even bad numbers. Enjoy!
I think one of the neat things to look at as a Canadian is the percentage based charts, particularly those of working age. I separated the charts out as a basis of percentage in groups from 0-14, 15-64 and 65+. You look at these things and you can see why we’re having some issues. For example, we here in Canada have 45% of the children we had in 1960 on a per capita basis. We also crossed the threshold of having more 65+ people than working age people back in 2010, the line was crossed for women back in 1988.
Another thing I see is that, for Canada, the percentage of adults goes up in bumps over the years but not so much for children. I suspect that is because despite having so much immigration in certain spots, even they are not having that many children either. That’s interesting to me as well.
Anyways, hope you enjoy. These charts are an interesting way to look at demographics in a different way from pyramid charts.
| Posted in Miscellaneous stuff | Comments Off on Demographic charts
Resolutions for SD image generation
When making images for StableDiffusion it’s best to take the aspect ratio in mind and make it fit into the total number of pixels that the model was trained on. This results in the best images for that given model. So, for SDXL it’s 1024×1024, others it may be 768×768 or even 512×512. Here is a list of effective X and Y values to total up to the most common aspect ratios for various training sizes. Obviously you would reverse the values if you go y/x.
1024x1024

Aspect Ratio 4:3 - Resolution: 1182x886
Aspect Ratio 16:9 - Resolution: 1365x768
Aspect Ratio 21:9 - Resolution: 1564x670
Aspect Ratio 1:1 - Resolution: 1024x1024
Aspect Ratio 3:2 - Resolution: 1254x836
Aspect Ratio 5:4 - Resolution: 1144x915
Aspect Ratio 16:10 - Resolution: 1295x809
Aspect Ratio 2:1 - Resolution: 1448x724
Aspect Ratio 18:9 - Resolution: 1448x724
Aspect Ratio 32:9 - Resolution: 1930x543
Aspect Ratio 3:1 - Resolution: 1773x591
Aspect Ratio 4:1 - Resolution: 2048x512
Aspect Ratio 5:3 - Resolution: 1321x793

768x768

Aspect Ratio 4:3 - Resolution: 886x665
Aspect Ratio 16:9 - Resolution: 1024x576
Aspect Ratio 21:9 - Resolution: 1173x502
Aspect Ratio 1:1 - Resolution: 768x768
Aspect Ratio 3:2 - Resolution: 940x627
Aspect Ratio 5:4 - Resolution: 858x686
Aspect Ratio 16:10 - Resolution: 971x607
Aspect Ratio 2:1 - Resolution: 1086x543
Aspect Ratio 18:9 - Resolution: 1086x543
Aspect Ratio 32:9 - Resolution: 1448x407
Aspect Ratio 3:1 - Resolution: 1330x443
Aspect Ratio 4:1 - Resolution: 1536x384
Aspect Ratio 5:3 - Resolution: 991x594

512x512

Aspect Ratio 4:3 - Resolution: 591x443
Aspect Ratio 16:9 - Resolution: 682x384
Aspect Ratio 21:9 - Resolution: 782x335
Aspect Ratio 1:1 - Resolution: 512x512
Aspect Ratio 3:2 - Resolution: 627x418
Aspect Ratio 5:4 - Resolution: 572x457
Aspect Ratio 16:10 - Resolution: 647x404
Aspect Ratio 2:1 - Resolution: 724x362
Aspect Ratio 18:9 - Resolution: 724x362
Aspect Ratio 32:9 - Resolution: 965x271
Aspect Ratio 3:1 - Resolution: 886x295
Aspect Ratio 4:1 - Resolution: 1024x256
Aspect Ratio 5:3 - Resolution: 660x396
So, if for some reason you need to calculate this on your own for some future or past resolution, here is the Python.
from sympy import symbols, Eq, solve

# Define symbols
x, y = symbols('x y')

# Equation 1: Total pixel count remains constant
total_pixels = 512*512

# List of common aspect ratios as tuples (width, height)
aspect_ratios = [
    (4, 3), (16, 9), (21, 9), (1, 1), (3, 2),
    (5, 4), (16, 10), (2, 1), (18, 9), (32, 9),
    (3, 1), (4, 1), (5, 3)
]

# Iterate over the aspect ratios and solve the equations
resolutions = []
for width_ratio, height_ratio in aspect_ratios:
    # Equation 2: Aspect ratio
    eq1 = Eq(x * y, total_pixels)
    eq2 = Eq(x / y, width_ratio / height_ratio)

    # Solve the equations
    solution = solve((eq1, eq2), (x, y))

    # Extract the resolution and convert to positive integers
    resolution = (abs(int(solution[0][0])), abs(int(solution[0][1])))
    resolutions.append((width_ratio, height_ratio, resolution))

# Print the results
for width_ratio, height_ratio, resolution in resolutions:
    print(f"Aspect Ratio {width_ratio}:{height_ratio} - Resolution: {resolution[0]}x{resolution[1]}")
As always, I guarantee nothing. enjoy.
| Posted in Miscellaneous stuff, Programming | Comments Off on Resolutions for SD image generation
An RTJ chart
Here is a chart for RTJ ring groove facings. It’s very specific to my own use case but maybe somebody else will find it useful. I guarantee nothing, if you use it, it’s at your own risk. Bottom width is the size at the bottom of the groove, Largest Ball is the largest ball that will sit tangent at the top of the groove, and well, Smallest is the one that will sit on the bottom and touch the two sides. Obviously you want to be somewhere between, not at, theses sizes. Also, the lists on the bottom denote the Depth, Width sets and the numbers that follow are the R sizes that match that set.
04.22.24A new start
Well, one can always begin anew. The last site had some bugs, stuff accumulated over the course of 15 years. It should be said that I probably could have fixed the issue with a bit of elbow grease but I felt as though it’d be good to start something fresh and start updating again.
Anyways, Thanks for coming!
| Posted in Miscellaneous stuff, Programming | Comments Off on DooM WAD Level Selector